Decoding the Ichimoku Cloud Trading Strategy
Blog Post
The ‘Ichimoku Cloud Trading Strategy’ helps a trader, to gauge the performance and position of a company instantly. The Ichimoku Cloud Trading Strategy is a set of technical indicators that show you the support and resistance levels in a particular session. At the same time, it also helps you determine the momentum and the trend direction. This strategy takes different averages and plots them on a chart. With the proper understanding of this strategy, you will be able to predict the next move happening in the trading curve. #TWN
Trading (Financial/ Share Market Trading) is one of the most popular means of making money for people around the world who intend to practice financial products and services to grow their wealth!
Making profits in Stock Trading Marketplace involves Market Monitoring Skills, Special tools to watch and follow trade types, and an in-depth understanding of market trends and scripts.
You need the right attitude to thrive in this dynamic and volatile industry of Financial Trading!
Having the traits of industry research and market analysis is always rewarding for traders as it helps in developing better decision making, or rather on time best call attribute.
In this digital world, there are many tools, patterns, charts, and technical indicators to assist you in your mission to make money!
One of the very effective strategic tools is the “Ichimoku Kinko Hyo”- In Japanese; and the English name being- "Ichimoku Trading Strategy"
Goichi Hosoda, Father of Ichimoku Cloud
The Ichimoku Cloud Trading Strategy is a set of technical indicators that show you the support and resistance levels in a particular session. At the same time, it also helps you determine the momentum and the trend direction. It is like the Japanese Candlestick Charting System. But it offers more data points that the standard chart! The term "Ichimoku" is a Japanese word meaning "One Look”. This word refers to the fact that this strategy helps you analyze the support and resistance levels in just one view. A Japanese journalist named Goichi Hosoda developed this technique in the 1960s.
Goichi Hosoda carried out a sincere coverage of rice markets. During this time, he chartered prices and finally developed a unique concept of support and resistance! By the end of the 1930s, he wanted to create a systematic approach to market evaluation! So he gathered several students to work on the computer, and the result came in 1968, in the form of Ichimoku Kinko Hyo.
Ichimoku Cloud Trading Strategy
The Ichimoku Trading Strategy is perhaps the most accurate and time-saving strategy! This strategy takes different averages and plots them on a chart. At the same time, the Ichimoku indicator uses the figures for the calculation of a 'cloud' trying to predict a particular point where the price of the script may find support or resistance on a specific day in the future! In the beginning, it may appear to be a bit complex. You may also be confused and have difficulty reading the lines! But once you learn to read them and understand the formulae, you will be able to decode the trading signals correctly!
The Ichimoku Cloud Formulae
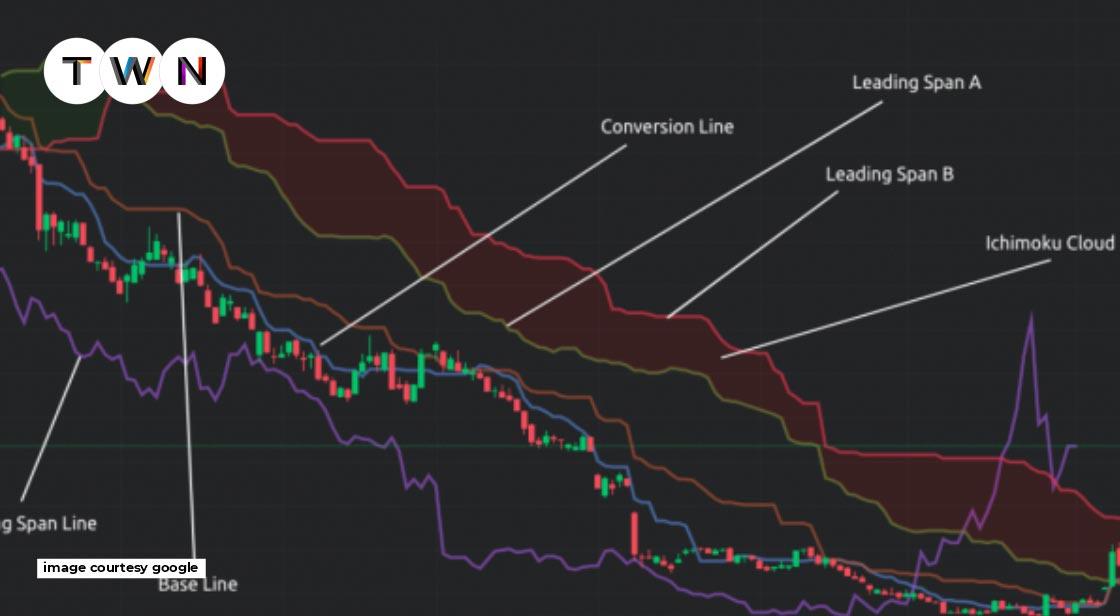
The Ichimoku Cloud consists of five lines. Two of these lines make a 'cloud.' The difference between the two lines is shaded in! The five lines contain: nine-period average | 26-period average | 52-period average | lagging closing price line | and an average of these two averages.
The 5 formulas for the lines comprising of Ichimoku Cloud Indicator are as follows-
Conversion Line (Tenkan Sen)= (9-PH +9-PL) / 2
Base Line (Kinjun Sen)=(26-PH +26-PL) / 2
Leading Span A (Senkou Span A) = (CL + Base Line) / 2
Leading Span B (Senkou Span B) = (52-PH + 52-PH) / 2
Lagging Span (Chikou Span) = Close Plotted 26 periods in the past
Note: PH = Period High | PL = Period Low | CL = Conversion Line
How to Calculate the Ichimoku Cloud!
When we calculate Ichimoku, highs are the high trading prices, and lows are the lowest trading prices! For example, if we consider the Conversion Line, then over the last 9 days, it could be the highest price or the lowest price. You can instantly add the Ichimoku Cloud Indicator to your calculation chart if you want to see the results quickly! But if you wish to do it by yourself, then it is not a difficult procedure. Just seven steps and you are on the cloud-
- Begin by calculating the Conversion Line and the Base Line.
- Based on the previous calculations, calculate the leading Span A. Once you complete the calculation, you will get the data points that are plotted for 26 periods in the future
- Calculate the Leading Span B and, similar to the Span A, plot it 26 periods in the future.
- Now, comes the Lagging Span! For this, plot the closing price for 26 periods in the past accurately on your chart of Technical Analysis.
- A point to note here is that the difference between Span A and Span B is colored! It is what makes the 'Cloud'!
- Then you will see that the Leading Span A is above the Leading Span B, so color the cloud in green color! It signifies the rising of prices. Contrary to this, if the Leading Span A appears below the Leading Span B. Color it with Red! It means that prices are going low!
- The above six steps will now create a single data point. For creating the lines, whenever every point ends, go to the above step once again! It will help you create new data points for every period. Ultimately, you can connect all data points and create the lines and clouds.
Benefits of the Ichimoku Trading Strategy - The Ichimoku Cloud has many benefits. It can help a trader in many ways. Let us see the benefits -
Upward Downward and Stable Trending- The Ichimoku Trading Strategy is an amazing technique to help you traverse the road to success! You can acquire relevant information about a specific company in just one view with the help of averages! When the prices rise above the cloud, you can see the trend shoot up! Contrarily, when the prices fall down below the cloud, the trend will go downwards! But when the price holds its position and stays in the cloud, the transition ceases to exist.
A Boon for Future Trades- The Ichimoku Cloud is beneficial because you can get the support and resistance levels crucial for future trades. It is a great quality where the Ichimoku Indicator outshines the rest Indicators because they only give the support and resistance levels for current trades, while Ichimoku provides the projection for future trades.
Maximize Risk-Adjusted Returns- A trader is always bothered about the risk factor involved in trading! Here you can think of combining a few other technical indicators with the Ichimoku Cloud Indicator. It can really help you to maximize your Risk-Adjusted Returns. For instance, use Ichimoku with Relative Strength to ensure the momentum of the price of a script in a certain direction.
A Powerful Buying Signal- Crossovers are also one way to use Ichimoku Cloud! You need to be alert and keep a watch on the Conversion Line and see if it rises above the Baseline, especially if the prices soar above the cloud! It serves as a powerful buying signal! You can also hold your trade until the Conversion Line falls down below the Baseline! You can also use any other line as an Exit point.
Also Read: Leading Trading Platforms across the Globe
Conclusion: The Ichimoku Trading Strategy may be complicated, but it is a great gift from Hosoda to the great community of traders! It minimizes the risk factor and helps them to earn profits. So traders, leave your worries, learn the Ichimoku Cloud trading Strategy, and trade as a maestro.
You May Like


EDITOR’S CHOICE